")


Monitoring Stations Avaliability:
| Station | Relevant Monitored Pollutants | Wind Measurement | Benzene Measurement | Map Location | Height | Leviathan Distance (KM) | Direction To Station From Leviathan |
|---|---|---|---|---|---|---|---|
| Igud – Caesarea Station | Benzen, SO2, NO2, NOX, PM2.5, O3, Toluen, Ethylb, O-Xyle | 100% (Good) | 91% (Good) | Zoom-In | 20 | 12.9 | North-West |
| Igud – Maayan Zvi Station | Benzen, SO2, NO2, NOX, PM2.5, O3, Toluen, Ethylb, O-Xyle | 100% (Good) | 90% (Good) | Zoom-In | 106 | 12.9 | West |
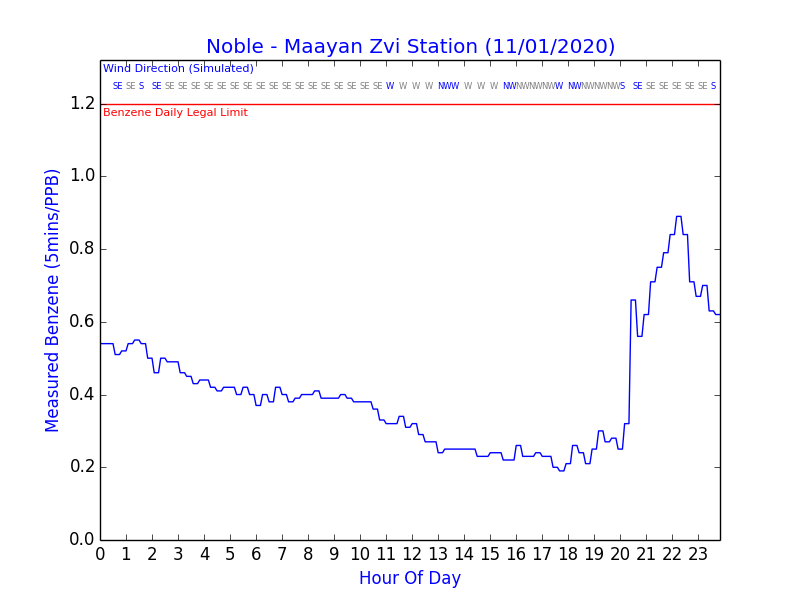
| Noble – Maayan Zvi Station | Benzen, O3, No2, Nox, O-Xyle, EthylB, TOLUENE | 0% (Dysfunctional) | 100% (Good) | Zoom-In | 106 | 12.9 | West |
| Igud – Nahsholim Station | Benzen, SO2, NO2, NOX, PM2.5, O3, Toluen, Ethylb, O-Xyle | 0% (Dysfunctional) | 0% (Dysfunctional) | Zoom-In | 6 | 11.4 | West |
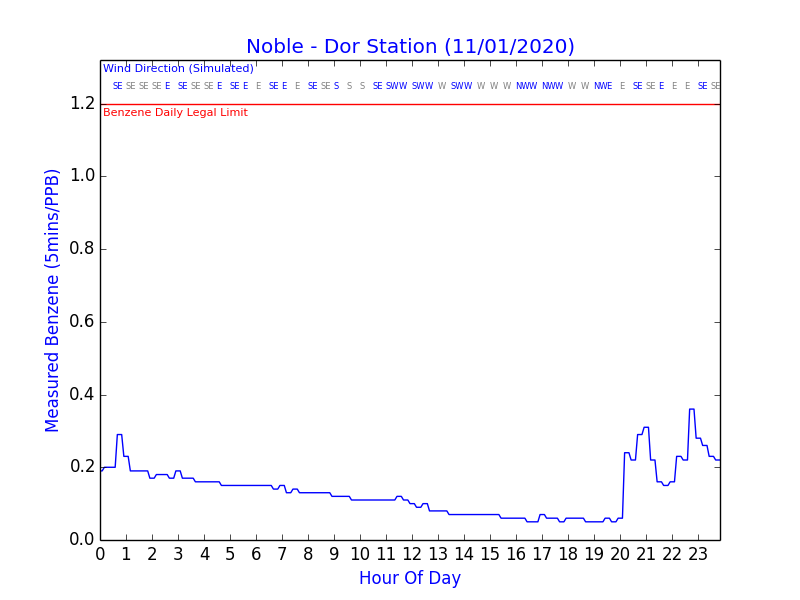
| Noble – Dor Station | Benzen, O3, No2, Nox, O-Xyle, EthylB, TOLUENE | 0% (Dysfunctional) | 100% (Good) | Zoom-In | 16 | 10.8 | West |
| MoEP – Mobile Zichron Station | Benzen, SO2, O3, EthylB, TOLUENE, PM2.5, No2, Nox | 0% (Dysfunctional) | 0% (Dysfunctional) | Zoom-In | 110 | 13.3 | West |
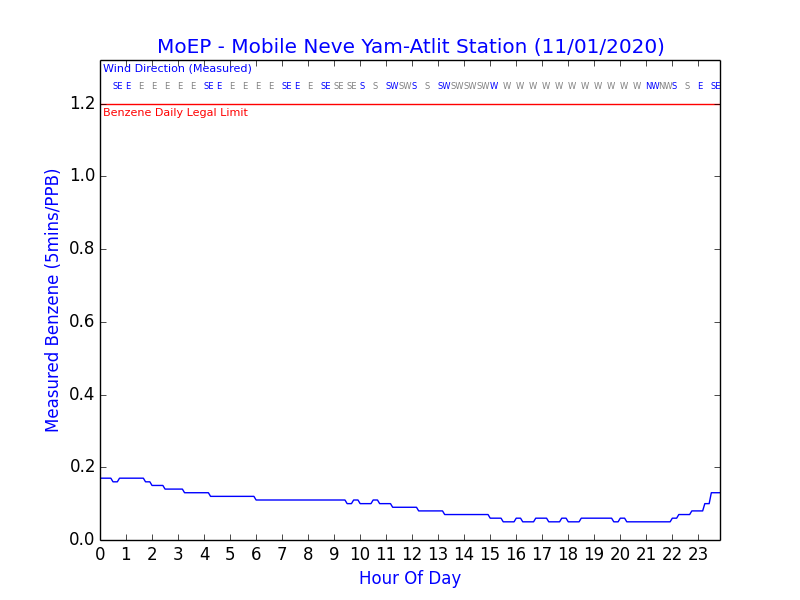
| MoEP – Mobile Neve Yam-Atlit Station | Benzen, EthylB, TOLUENE, SO2, PM10, PM2.5, O3, No2, Nox | 100% (Good) | 100% (Good) | Zoom-In | 0 | 15 | South-West |
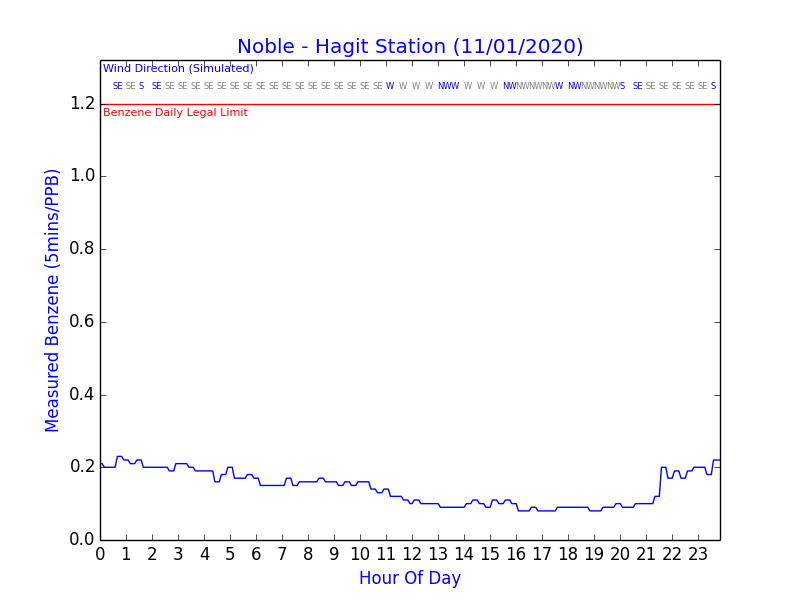
| Noble – Hagit Station | Benzen, O-Xyle, EthylB, TOLUENE | 0% (Dysfunctional) | 100% (Good) | Zoom-In | 185 |
Pollutants Averages Compared To Legal Values:
| Benzene | Benzene | Benzene | Toluen | Toluen | Ethylb | OXyle | NOX | NOX | NO2 | PM2.5 | PM2.5 | PM10 | PM10 | O3 | O3 | SO2 | SO2 | |
|---|---|---|---|---|---|---|---|---|---|---|---|---|---|---|---|---|---|---|
| Units | PPB | PPB | PPB | PPB | PPB | PPB | PPB | PPB | PPB | ug-m3 | ug-m3 | ug-m3 | ug-m3 | PPB | PPB | PPB | PPB | PPB |
| Legal Limit | None | 1.2 | None | None | 1000 | None | None | 500 | 298 | 106 | None | 37.5 | None | 130 | None | 71 | 134 | 19 |
| Time Period | Hourly | Daily | Max | Hourly | Daily | Daily | Daily | Half Hourly | Daily | Hourly | Hourly | Daily | Hourly | Daily | Hourly | 8-Hourly | Hourly | Daily |
| Igud – Caesarea Station | 0.67 | 0.33 | 0.70 | 1.08 | 0.42 | 0.09 | 0.10 | 27.33 | 8.60 | 23.75 | 34.56 | 22.34 | 0.23 | 0.10 | 46.92 | 36.50 | 2.18 | 1.13 |
| Igud – Maayan Zvi Station | 0.42 | 0.20 | 0.45 | 0.69 | 0.20 | 0.04 | 0.05 | 16.00 | 6.16 | 14.25 | 26.77 | 11.00 | 0.13 | 0.05 | 43.17 | 35.09 | 0.50 | 0.29 |
| Noble – Maayan Zvi Station | 0.82 | 0.40 | 0.89 | 1.28 | 0.37 | 0.05 | 0.07 | 16.43 | 7.14 | 14.17 | 50.88 | 41.61 | ||||||
| Igud – Nahsholim Station | 0.00 | 0.00 | ||||||||||||||||
| Noble – Dor Station | 0.25 | 0.14 | 0.36 | 0.35 | 0.14 | 0.02 | 0.03 | 18.93 | 8.26 | 15.98 | 47.82 | 37.86 | ||||||
| MoEP – Mobile Zichron Station | 0.00 | 0.00 | 17.28 | 7.42 | 14.33 | 24.27 | 11.07 | 41.60 | 34.10 | 1.23 | 1.05 | |||||||
| MoEP – Mobile Neve Yam-Atlit Station | 0.17 | 0.09 | 0.17 | 0.11 | 0.05 | 0.01 | 7.37 | 3.91 | 7.12 | 50.02 | 44.08 | 0.67 | 0.61 | |||||
| Noble – Hagit Station | 0.21 | 0.14 | 0.23 | 0.26 | 0.12 | 0.02 | 0.02 |
Monitoring Gaps Alerts Detected:
| Station | Start Time | End Time | Total Unmonitored Time (Hours) |
|---|---|---|---|
| Igud – Caesarea Station | 04:20:00 | 06:35:00 | 2:15:00 |
| Igud – Maayan Zvi Station | 01:15:00 | 03:35:00 | 2:20:00 |
| MoEP – Mobile Zichron Station | 00:05:00 | 23:59:00 | 23:54:00 |
No Benzene Pollution Event Alerts Detected
No Other Pollution Event Alerts Detected
Notes:
- This report integrates and calculates monitoring data from both the Israeli MoEP and Igud Arim Sharon-Carmel monitoring sites
- 'Clean Air Law' legal Air value max limits can be found here
- Benzene Israeli Max allowed 24-Hours Average limit is 1.2 PPB
- For each monitoring station, Avaliability grade is calculated
- On properly operated stations, measurements should be conducted once per 5 minutes, producing high Avaliability grade
- Stations that do not monitor for more than 1-Hour will produce a Monitoring Gap Alert, For more than 4-Hours a broadcast email would be sent
- The pollutants averages table shows the legal limits defined in the Israeli law, compared to the level of pollutants form all monitored stations
- Different pollutants have different averaging Time-Period defined by law, The report calculates averages in all relevant resolution, For example –
- For Daily time period – Average of all the pollutant's values in the entire day is calculated
- For Hourly time period, the average of each hour in the day is calculated separately, then the highest hourly average is chosen for display
- Each Pollutant 5-Minutes measurements >= 85% (Or 100% for PM25) Of lowest time resolution legal-limit will be shown as a Pollution Event Alert (Even though Israel legal standard might refer to daily average)
- Pollution Event Alerts are meant to give an early warning in order to prevent violations of the daily legal limit – Not to wait for a full day of violations to occur before alerting the public
- Alerts are defined for the following monitored pollutants (Bound to station limitations): Benzen, Toluen, PM2.5, PM10, NOX, NO2, SO2, O3
- For each alerted pollutant, full-day graph will be generated (With legal limit marked as red line) and a broadcast email would be sent
- For each Benzen alert, All other pollutants at the time of alert are also dispalyed, including pollutants direction trend (↗ ↘ Arrows calculated comparing current pollutant value to it's running average)
- For Benzen, Full-day graphs will always be generated (Even without alert), since as a worst-case BTEX indicator pollutant we would like be aware of even partial unusual increase
- Verbal description of the Pollutants Source Direction is calculated from wind data for each alert
- Stations without wind measurements, Receive simulated average wind direction of nearby stations
- Leviathan's direction to each monitoring station is displayed and can be compared to alerts directions